Tip
TipThe BI Charts section lets you configure the access details of the BI Charts to view the available Business Intelligence reports. Based on the configuration, you can access the Reports from the FASTER Web application.
Tip
To view the BI Charts Settings dialog box, click the BI Charts link.
The Edit BI Chart Settings dialog box lets you configure the BI Charts in the application.
1. Click the Setup module.
2. In the Application Setup section, do one of the following:
§ Click  next to the Reports option, and then click Settings.
§ In the Reports section of Application Setup, click the Settings link.
The Reports Settings page opens.
3. In the BI Charts section, click Edit BI Charts Settings.
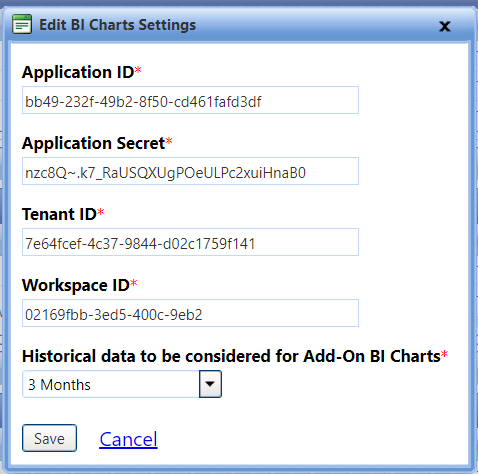
The Edit BI Charts Settings dialog box opens.
The following table provides the Field Name and Description for the Edit BI Charts Settings dialog box.
|
Field Name |
Description |
|
Application ID |
Provide the Application ID from Azure that is given access on the Power BI Service. |
|
Application Secret |
Provide the Application Secret from Azure. |
|
Tenant ID |
Provide the Tenant ID from Azure. |
|
Workspace ID |
Provide the Workspace ID from the Power BI Service under which the Power BI Charts are published. |
|
Historical data to be considered for Add-On BI Charts |
Select the time frame that will be used for retrieving information for Add-On BI Charts. |
4. Click one of the following: