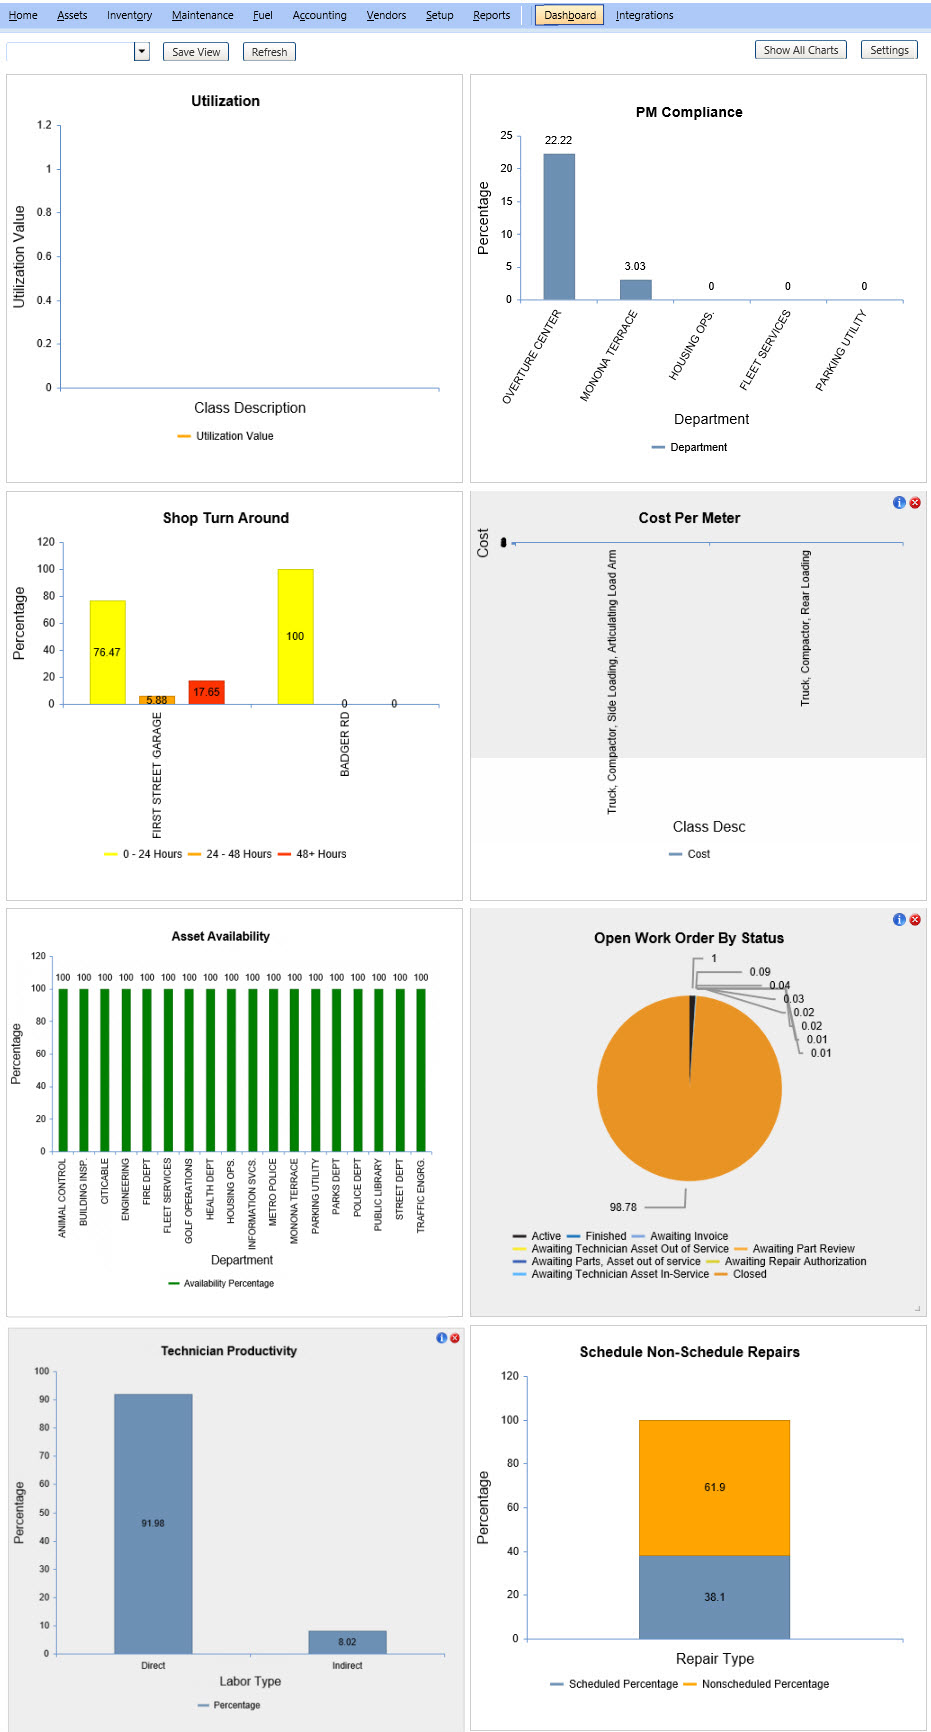
The FASTER Web Dashboard add-on lets you view the charts of the 12 KPIs such as Shop Turn Around and Comeback Repairs, and landing charts of the 8 FASTER Web modules such as Assets and Inventory.
In the FASTER Web Dashboard, you can do the following:
· Saving charts and creating Views
To view all the charts (KPIs and module landing charts) on one screen, click Show All Charts.

Dashboard
To remove a KPI chart from view altogether, right-click ![]() on the upper right corner of the KPI chart. To get it back, click Show All Charts, and then remove the charts you do not want to see.
on the upper right corner of the KPI chart. To get it back, click Show All Charts, and then remove the charts you do not want to see.
When you close a chart, the space of the closed chart is left blank. You can expand or move another chart into the blank space, as required. To change the size of a chart, click the bottom right corner of the chart and drag it to the required size.
Note: FASTER Web version 6.4 provides a brand new dashboard with new capabilities. You must build new Saved Views when you upgrade to FASTER Web 6.4. If you are in a Saved View and the KPI is unavailable, you must select the 'blank' from the View drop-down in the upper left portion of the screen, then build a view with the missing KPI.